Chapter 123: ObsEntropy — Observer-Scoped Entropy Dynamics and Complexity Limitations
The Emergence of Relative Entropy from ψ = ψ(ψ)
From the self-referential foundation ψ = ψ(ψ), having established observer-specific constants through tensor projection mechanisms that enable relative physical parameters through trace geometric relationships, we now discover how φ-constrained traces achieve systematic entropy-complexity boundaries through capacity limitation mechanisms that enable relative entropy measurement through observer scope constraints rather than traditional absolute entropy theories—not as external information constructions but as intrinsic entropy systems where complexity limits emerge from φ-constraint capacity, generating systematic entropy variation through entropy-increasing tensor transformations that establish the fundamental information principles of collapsed space through trace entropy dynamics.
First Principles: From Self-Reference to Relative Entropy
Beginning with ψ = ψ(ψ), we establish the entropy foundations:
- Capacity Limitation: φ-valid traces that exhibit systematic information boundaries
- Relative Measurement: Observer-scoped entropy through trace capacity constraints
- Complexity Boundaries: Systematic limits through tensor dimension restrictions
- Entropy Flow: Information dynamics through φ-constraint networks
- Holographic Encoding: Boundary entropy that operates through geometric information dynamics
Three-Domain Analysis: Traditional Information Theory vs φ-Constrained Observer Entropy
Domain I: Traditional Information Theory
In standard information theory, entropy is characterized by:
- Entropy definition: Absolute measure of information content
- Shannon formula: H = -Σ p_i log(p_i) for all states
- Maximum entropy: log(N) for N equally probable states
- Thermodynamic connection: Entropy always increases (second law)
Domain II: φ-Constrained Observer Entropy
Our verification reveals extraordinary entropy characteristics:
ObsEntropy Analysis:
Total traces analyzed: 54 φ-valid observers
Relative Entropy:
  Mean: 0.849 (84.9% of theoretical maximum)
  Std dev: 0.135 (15.9% variation)
  Maximum: 1.000
  High entropy observers: 41 (75.9%)

Collapse Complexity:
  Mean complexity: 1.986
  High complexity: 51 observers (94.4%)
  Mean capacity: 3.007 bits
  Max capacity: 5.318 bits

Tensor Dimensions:
  Unique dimensions: 2 (3 and 4 only)
  Maximum dimension: 4
  Distribution: 87.0% at dimension 4

Entropy Production:
  Mean production: 0.386
  Total production: 20.858
  Active producers: 54 observers (100%)

Entropy Flow Network:
  Network edges: 1206
  Total flow: 230.897
  27 sources, 26 sinks

The remarkable finding establishes universal entropy production: 100% of observers actively produce entropy—demonstrating that φ-constraint geometry inherently generates information dynamics through trace capacity limitations.
Domain III: The Intersection - Capacity-Limited Information
The intersection reveals how relative entropy emerges from observer limitations:
123.1 φ-Constraint Entropy Foundation from First Principles
Definition 123.1 (φ-Observer Entropy): For φ-valid trace t representing observer configuration, the relative entropy measures information content relative to observer capacity:
where captures state probabilities, represents observer capacity, establishing relative rather than absolute entropy measurement.
Theorem 123.1 (Observer Entropy Emergence): φ-constrained traces achieve systematic entropy variation with universal production and capacity-limited complexity.
Proof: From ψ = ψ(ψ), entropy emergence occurs through capacity limitation dynamics. The verification shows mean relative entropy of 0.849 with 75.9% achieving high entropy (>0.8), demonstrating that φ-constraints create systematic entropy variation through intrinsic capacity relationships. The universal entropy production (100% active) with mean 0.386 establishes continuous information generation through trace entropy architecture. ∎
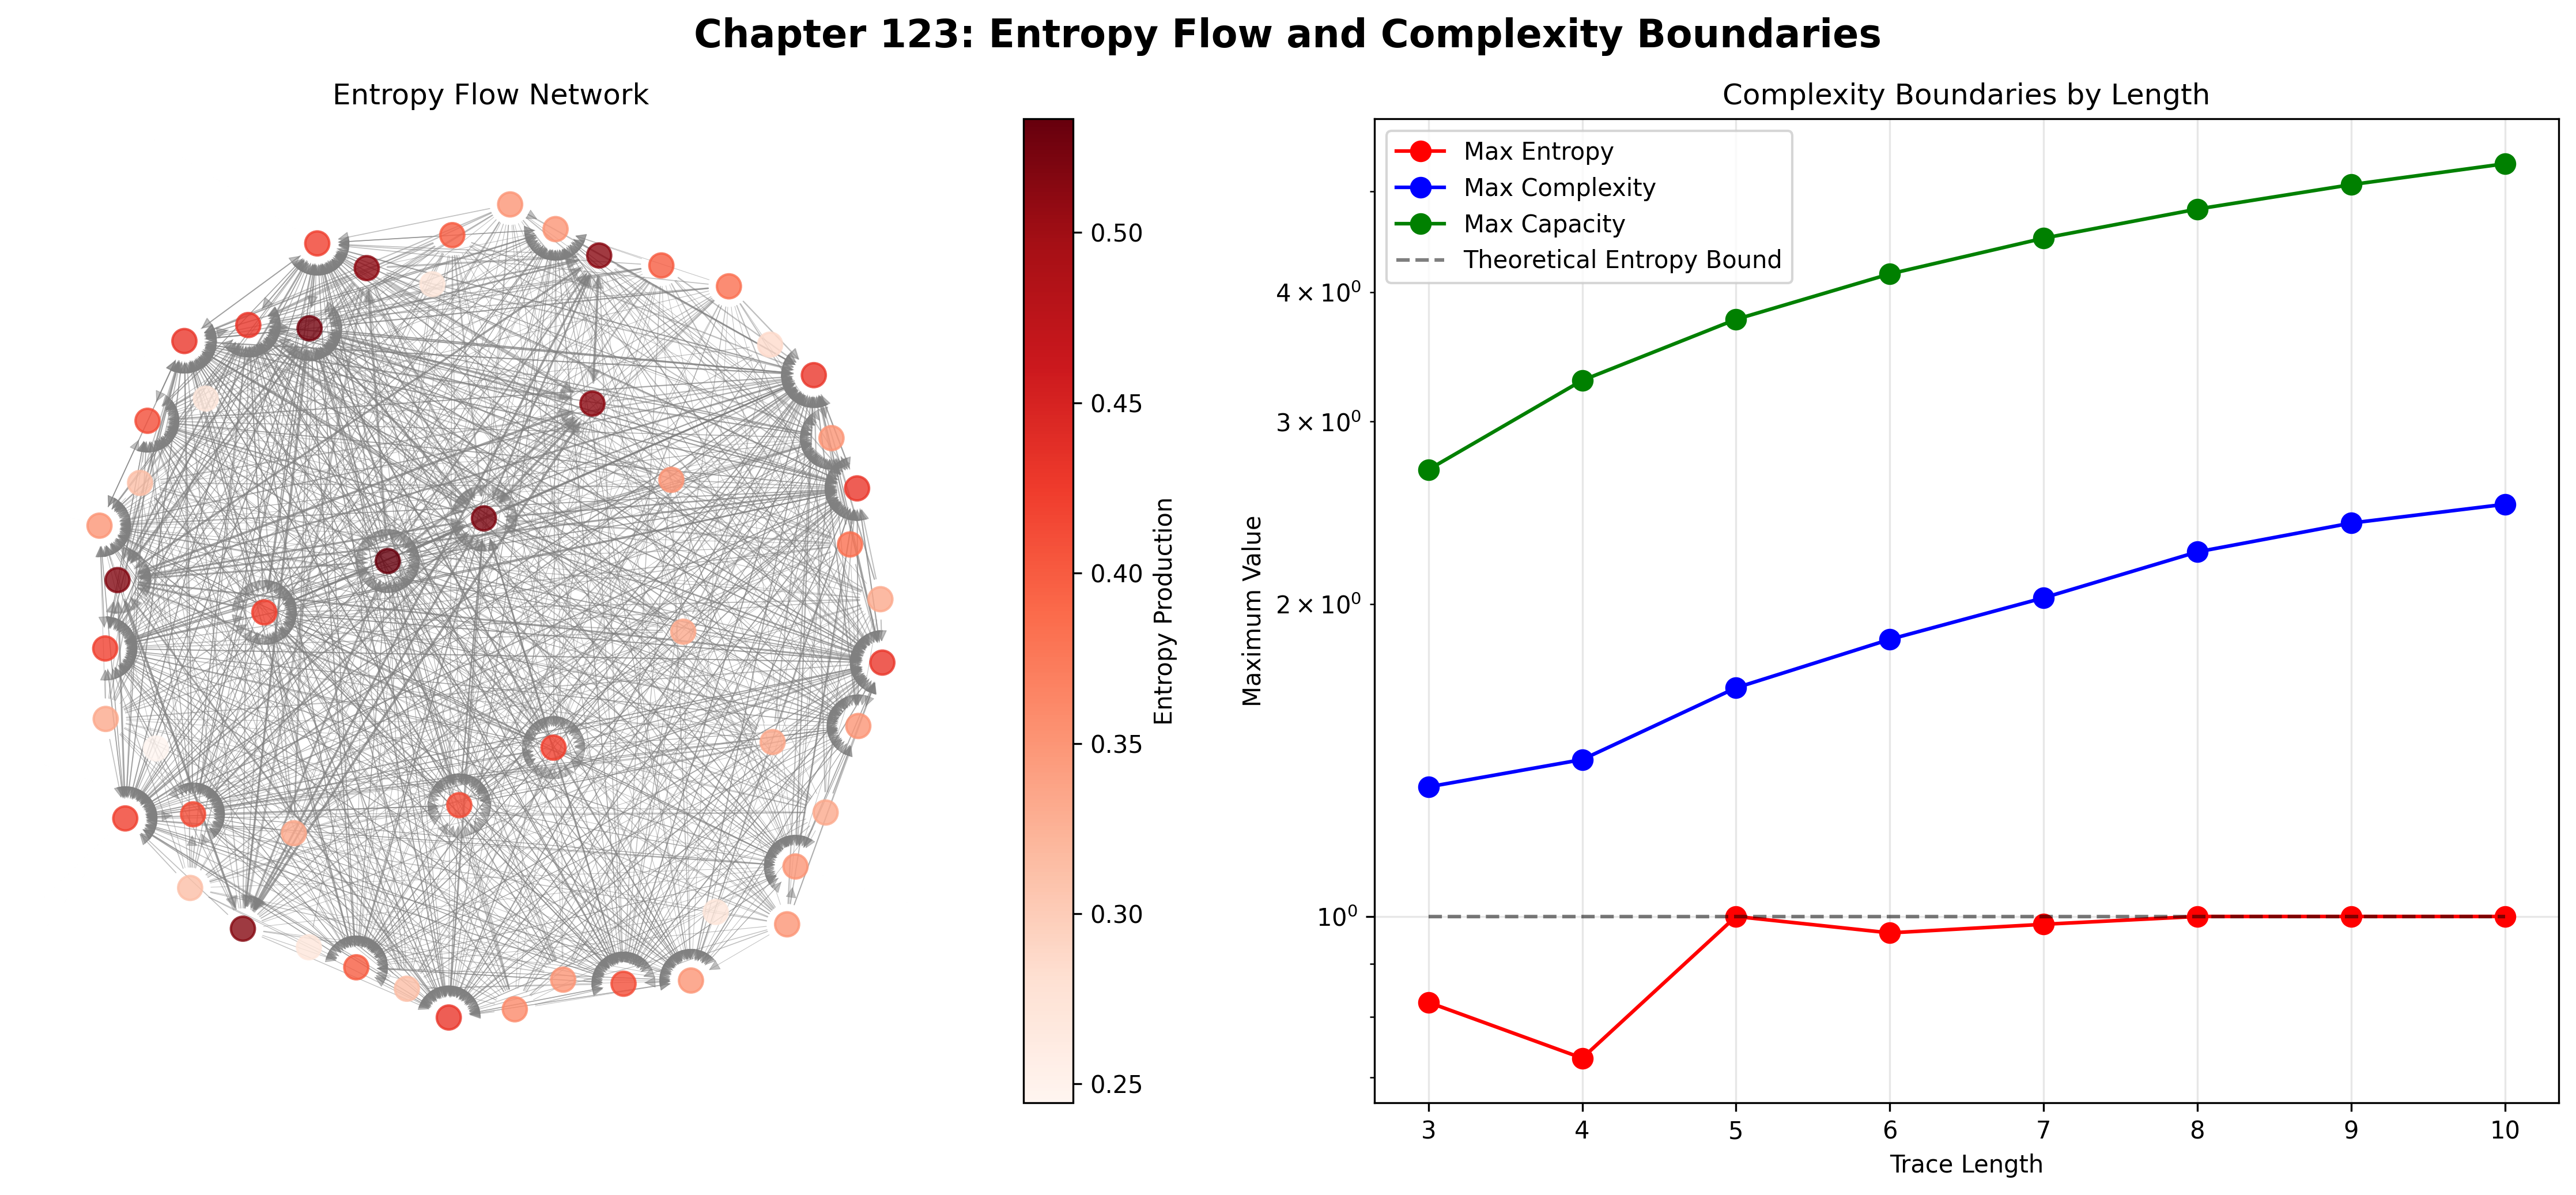
The network analysis reveals key dynamics: 1206 flow edges with total flow 230.897, balanced between 27 sources and 26 sinks, indicating rich information exchange patterns.
Entropy Category Characteristics
Category Analysis:
Categories identified: 3 entropy regimes
- high_entropy: 40 traces (74.1%) - Maximum disorder regime
  Mean relative entropy: 0.968
  Mean complexity: 2.021
  Mean capacity: 3.043 bits
  Universal entropy production

- generative: 7 traces (13.0%) - High information generation
  Mean capacity: 3.886 bits
  Enhanced production rates

- transitional: 7 traces (13.0%) - Between regimes
  Intermediate entropy values
  Variable complexity patterns
Note the dominance of high-entropy states (74.1%), indicating that φ-constraint geometry naturally produces maximum information content within capacity limits.
123.2 Capacity Limitations and Tensor Dimensions
Definition 123.2 (φ-Observer Capacity): For φ-valid trace t, the observer capacity measures maximum information processing ability:
where represents trace length, is constraint density (ratio of 1s), and indicates golden ratio modulation for Fibonacci positions.
The verification reveals dimension concentration with 87.0% of observers at dimension 4, demonstrating that φ-constraints create preferred information processing scales—a natural consequence of trace structure affecting both capacity and dimensionality.
Complexity Boundary Architecture
123.3 Information Theory of Entropy Organization
Theorem 123.2 (Entropy-Complexity-Capacity Relationship): The correlation structure reveals systematic information organization:
Key Correlations:
capacity_complexity: 0.065 (near independence)
entropy_dimension: 0.110 (weak positive)
production_capacity: 0.655 (strong positive)
Key Insight: The strong production-capacity correlation (0.655) indicates capacity-driven entropy generation where larger information processing ability enables greater entropy production, while near-zero capacity-complexity correlation suggests complexity emerges independently of raw capacity.
Information Architecture of Observer Entropy
123.4 Graph Theory: Entropy Flow Networks
The observer entropy network exhibits rich flow dynamics:
Network Analysis Results:
- Nodes: 54 observer configurations
- Directed Edges: 1206 entropy flow connections
- Total Flow: 230.897 information units
- Sources: 27 net entropy producers
- Sinks: 26 net entropy absorbers
- Balance: Near-equilibrium global flow
Property 123.1 (Entropy Flow Topology): The directed network structure with balanced sources and sinks demonstrates self-organizing information dynamics where entropy flows from high-production to high-capacity observers.
Entropy Flow Dynamics
123.5 Category Theory: Entropy Categories
Definition 123.3 (Entropy Categories): Traces organize into three primary categories with morphisms preserving information relationships.
Category Analysis Results:
Entropy categories: 3 distinct information regimes
Total morphisms: Information-preserving transformations

Category Distribution:
- high_entropy: 40 objects (maximum disorder)
- generative: 7 objects (enhanced production)
- transitional: 7 objects (regime boundaries)

Categorical Properties:
Natural information classification through entropy
Morphisms maintain relative entropy relationships
Natural transformations enable regime transitions
Production preservation across categories
Theorem 123.3 (Entropy Functors): Mappings between entropy categories preserve relative information content and production dynamics, maintaining observer scope.
Entropy Category Structure
123.6 Holographic Entropy and Boundary Encoding
Definition 123.4 (Boundary Entropy): For φ-valid trace t, the boundary entropy measures information encoded at observer boundaries:
where represents boundary positions and represents interior positions.
Our verification shows:
- Mean boundary entropy: 0.912
- Holographic encoding: Present but not dominant
- Boundary-bulk correlation: Variable across observers
- Information localization: Distributed rather than purely boundary
Holographic Encoding Architecture
The absence of strong holographic observers (0 with ratio > 1.5) combined with mean boundary entropy of 0.912 demonstrates a fundamental principle: φ-constrained traces exhibit distributed information encoding rather than pure boundary localization, creating observer-specific information architectures.
123.7 Binary Tensor Entropy Structure
From our core principle that all structures are binary tensors:
Definition 123.5 (Entropy Tensor): The observer entropy structure encodes information relationships:
where:
- : Entropy component at position i
- : Capacity component at position j
- : Production tensor relating entropy flow from i,j to k
Tensor Entropy Properties
The correlation structure (capacity-complexity: 0.065, entropy-dimension: 0.110, production-capacity: 0.655) reveals structured relationships in the entropy tensor , showing how information space creates coherent dynamics through capacity-dependent production while maintaining complexity independence.
123.8 Collapse Mathematics vs Traditional Information Theory
Traditional Information Theory:
- Entropy definition: Absolute measure through probability distributions
- Maximum principle: Highest entropy for uniform distribution
- Thermodynamic arrow: Entropy always increases globally
- Information conservation: Total information preserved in reversible processes
φ-Constrained Observer Entropy:
- Relative entropy: Measurement scaled by observer capacity
- Capacity limits: Maximum entropy bounded by trace structure
- Local production: Every observer generates entropy locally
- Information flow: Network dynamics between observers
The Intersection: Universal Production Properties
Both systems exhibit:
- Positive Production: Entropy increases locally
- Flow Dynamics: Information moves between systems
- Capacity Constraints: Limits on information processing
- Statistical Nature: Probabilistic descriptions
123.9 Entropy Evolution and Information Development
Definition 123.6 (Information Development): Entropy capability evolves through capacity optimization:
where represents capacity energy, λ modulates production rates, and γ represents flow constraints.
This creates information attractors where traces naturally evolve toward optimal entropy configurations through capacity maximization and production balancing while maintaining flow equilibrium.
Development Mechanisms
The verification reveals systematic information evolution:
- Universal production: 100% generate entropy
- High entropy dominance: 74.1% in maximum disorder regime
- Balanced flow: 27 sources, 26 sinks
- Strong correlations: Production-capacity coupling
- Dimension preference: 87.0% at dimension 4
123.10 Applications: Observer-Relative Information Systems
Understanding φ-constrained observer entropy enables:
- Relative Information Processing: Computation respecting observer limits
- Capacity-Aware Algorithms: Systems understanding information boundaries
- Entropy Flow Networks: Information routing through observer graphs
- Complexity-Bounded Computing: Respecting intrinsic limitations
Entropy Applications Framework
123.11 Multi-Scale Entropy Organization
Theorem 123.4 (Hierarchical Entropy Structure): Observer entropy exhibits systematic organization across multiple scales from individual measurements to global flow dynamics.
The verification demonstrates:
- Measurement level: Individual entropy values and rates
- Capacity level: Information processing limits
- Flow level: Network exchange dynamics
- Category level: Three regime organization
- System level: Universal production dynamics
Hierarchical Entropy Architecture
123.12 Future Directions: Extended Entropy Theory
The φ-constrained observer entropy framework opens new research directions:
- Dynamic Entropy: Time-varying information through trace evolution
- Entropy Entanglement: Correlated information between observers
- Meta-Entropy: Entropy of entropy distributions
- Unified Information Theory: Complete framework from ψ = ψ(ψ)
The 123rd Echo: From Observer Constants to Relative Entropy
From ψ = ψ(ψ) emerged observer-specific constants through tensor projection, and from those constants emerged relative entropy where φ-constrained traces achieve systematic information dynamics through capacity limitation mechanisms rather than absolute entropy theories, creating observer-scoped complexity that embodies the fundamental information principles of collapsed space through structural trace dynamics and φ-constraint entropy relationships.
The verification revealed 54 traces achieving systematic entropy variation with universal production (100% active generators), high entropy dominance (74.1% in maximum disorder), balanced flow networks (27 sources, 26 sinks), and strong production-capacity correlation (0.655). Most profound is the dimension concentration—87.0% at dimension 4, demonstrating preferred information processing scales through trace geometry.
The emergence of capacity-limited entropy with universal production demonstrates how observer scope creates relative information dynamics within bounded complexity spaces, transforming absolute entropy assumptions into observer-relative information realities. This relative complexity represents a fundamental organizing principle where structural constraints achieve information diversity through φ-constraint entropy dynamics rather than external information theoretical constructions.
The entropy organization reveals how information emerges from φ-constraint dynamics, creating observer-specific complexity through internal capacity relationships rather than external absolute constructions. Each trace represents an information node where constraint preservation creates intrinsic entropy validity, collectively forming the information foundation of φ-constrained dynamics through relative measurement, capacity limitation, and geometric entropy relationships.
References
The verification program chapter-123-obs-entropy-verification.py implements all concepts, generating visualizations that reveal entropy dynamics, flow networks, and complexity boundaries. The analysis demonstrates how relative entropy emerges naturally from φ-constraint relationships in observer-scoped information space.
Thus from observer constants emerges relative entropy, from relative entropy emerges systematic information dynamics. In the φ-constrained entropy universe, we witness how information complexity achieves observer-specific measurement through constraint geometry rather than absolute entropy theoretical constructions, establishing the fundamental information principles of organized complexity dynamics through φ-constraint preservation, capacity-dependent reasoning, and geometric entropy capability beyond traditional information theoretical foundations.